In this guide
- 01Understand
- 02Explore
- 03Apply
- 04Reflect
A journey map shows the steps a particular person takes to reach a goal with a service, in the order they happen. It usually sets out stages, what the person does, thinks and feels, the touchpoints and channels involved, and the places where things go wrong or could be better. Its value is a shared view from the outside: one step after another, rather than one department after another.
The map is only as good as the evidence behind it. A wall of sticky notes produced in an afternoon can look convincing while mostly recording what staff believe customers experience. The practical discipline is to mark, cell by cell, what comes from data and what is still an assumption, and then to follow each step backstage to the people and systems that make it happen.
This guide shows how, using a fictional council’s residential parking-permit service as the worked example.
What a journey map shows
Sarah Gibbons’s “Journey Mapping 101” for Nielsen Norman Group defines a journey map as a visualisation of the process a person goes through to accomplish a goal. Her core elements are an actor, a scenario with expectations, journey phases, the person’s actions, mindsets and emotions, and the opportunities the map reveals. She recommends one point of view per map, because a single actor keeps the story clear.
Lemon and Verhoef’s review in the Journal of Marketing distinguishes touchpoints an organisation owns, those it shares with partners, those that belong to the customer, and social or external ones such as other people’s advice. The typology is conceptual, but it asks a useful question of every cell: who can actually change this step? A council controls its application form, not a leasing company’s paperwork.
Følstad and Kvale’s systematic review of 45 papers found customer journeys described both as a way to take the customer’s viewpoint and as a route to insight into their experiences. It found the terminology rich and at times incoherent, and distinguished mapping a service “as is” from generative work on a possible service “to be”.
That distinction matters. A current-state map records what happens now; a future-state map proposes what should happen. Kate Kaplan’s NN/g article on journey-mapping approaches treats this as one of two decisions to make before starting, and suggests most teams map the current state first. Mixing the two on one sheet makes it hard to tell which pain points are real and which improvements are only hoped for.
Journey map, experience map, blueprint or story map?
Related tools answer different questions. The distinctions below follow NN/g’s usage; other organisations use the same words differently, so agree definitions at the start.
| Tool | Main question | Whose viewpoint |
|---|---|---|
| Journey map | What does this person go through to reach this goal with this service? | One actor, over time |
| Experience map | What do people go through in a wider activity, whoever provides it? | People in general, not one product |
| Service blueprint | What must staff, systems and partners do to deliver each step? | The organisation, anchored to the customer’s actions |
| User-story map | What should we build, and in what order? | The delivery team planning work |
Gibbons describes service blueprints as extensions of journey maps that take the business’s perspective, and user-story maps as planning tools rather than discovery tools. GOV.UK’s guidance on creating an experience map uses “experience map” differently, for a research-based map of what users do, think and feel from the point they start needing a service until they stop using it. The label matters less than the scope.
The service blueprint is the closest relative. Bitner, Ostrom and Morgan’s 2008 article sets out its components: customer actions in sequence, onstage actions by contact employees, backstage actions below a “line of visibility”, support processes, and the physical evidence customers encounter. This guide borrows only the backstage layer. Build a full blueprint when the next decision concerns roles, systems and handoffs in detail.
Start with one actor, one scenario and one goal
Consider a fictional city council, Wenmouth, and its residential parking permits. A resident who moves into a controlled-parking zone must apply online, upload proof of address and vehicle documents, wait while the permits team checks them, and then receive a virtual permit linked to their number plate. Enforcement officers check plates with handheld devices. An IT supplier runs the permit system and the data feed to those devices.
The council’s service-improvement lead has rising complaints and a vague brief: “map the permit journey”. Her first useful move is to narrow it. The actor is a resident applying for a first permit after moving into the zone. The scenario begins when they realise they need a permit and ends when they can park without risk of a penalty. Renewals and visitor permits are left out. Like choosing a search field for innovation opportunities, choosing which journey to map decides where the team looks and what it leaves out.
Even that scope hides different journeys. Amira drives a car leased through her employer, so the vehicle’s registration document names the leasing company, not her. Tom works night shifts, has a basic phone rather than a smartphone, and has no broadband yet in his new flat. Both want the same outcome, but their steps diverge at the first document request.
Bitner and colleagues recommend specifying which customer segment a blueprint describes, because organisations often serve segments differently. GOV.UK’s experience-map guidance is more concrete: create one consolidated map if research participants went through the same stages and similar steps, and separate maps for different user groups if their stages and steps differ significantly. Make that call after the research. You cannot know which differences matter until you have heard the journeys.
Gather evidence before drawing anything
Collect accounts and records of real journeys first. Useful sources include:
- interviews that reconstruct one recent application step by step
- observation of someone applying, at home, in a library or at a service counter
- contact-centre records showing why people call, and at which stage
- web analytics showing where online sessions end
- complaints, penalty appeals and staff notes about exceptions.
Each source has a blind spot. Analytics show where sessions stop, not why. Call reasons show what staff coded, which may not be what the caller meant. Interviews give accounts shaped by memory. Use interviews that reconstruct a recent experience rather than asking people what they would like, and look for residents who gave up as well as those who finished.
In Wenmouth, the source that seemed most complete was the most misleading. Staff key assisted applications into the same online form, so if Tom eventually applied at a council office, his route would appear in the analytics as an ordinary online application. The data looked comprehensive precisely where it could not see.
Kaplan describes two starting points: an assumption-first workshop that draws on what the team already knows, or a research-first map built from primary user research. Her warning is specific: the process often stops before validation, and a hypothesis map ends up informing critical decisions. Wenmouth began that way, with a two-hour workshop that produced a tidy poster of “a typical resident” nobody could trace to evidence. Lemon and Verhoef add that mapping from the customer’s perspective requires customer input, and that journeys developed internally may easily become obsolete. Our Double Diamond guide makes the same point about discovery work: do not disguise an incomplete sample with an attractive journey map.
Mark what is known and what is assumed
Once the research is in, draft the map in a working session. Two to three hours with four to eight people who know different parts of the service is a practical starting choice, not a rule. Agree the stages first, then fill in what the resident does and sees at each one.
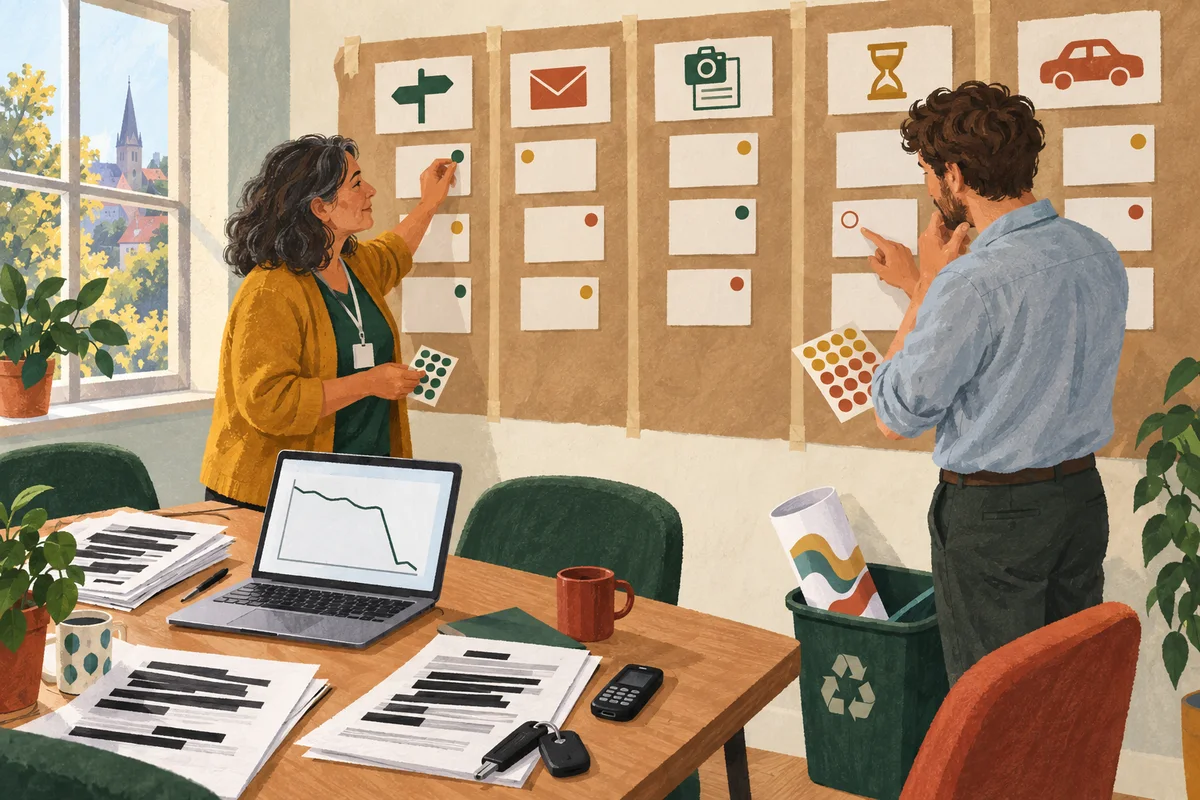
Give every cell an evidence marker. Four are enough: observed (seen in a session), reported (someone’s account), record (logs, analytics or case files) and assumed (a team belief not yet checked). The marker tells a reader how much weight the cell can bear.
The Wenmouth team’s current-state draft of the shared stages looked like this. The entries are invented for illustration.
| Stage | What the resident does or sees | Evidence | Pain point or open question |
|---|---|---|---|
| Learns a permit is needed | Sees zone signs or finds a warning notice on the windscreen | Record: appeal files. Reported: interviews | Do new residents hear about permits before their first penalty? |
| Starts the application | Creates an account and confirms an email address | Record: analytics. Observed: a library session | The form assumes a working inbox; Tom has none to hand |
| Uploads documents | Photographs a tenancy agreement and a vehicle document | Record: call reasons. Reported: interviews | Lease-car holders cannot supply the keeper document the form requests |
| Waits for a decision | Receives an automatic acknowledgement, then hears nothing | Assumed: staff believe checks take about a week | How long do checks take, and how is a rejected upload explained? |
| Receives the permit | Gets an email saying the permit is active and parks that evening | Record: appeal files. Reported: enforcement supervisor | Do handheld devices show a new permit straight away? |
Notice what the evidence column does to the emotional curve. The team’s first workshop draft had one line for “a typical resident”, dipping at the upload and rising at approval. The interviews suggested that Amira’s lowest point came after she expected approval, when her upload was rejected, and Tom’s came at the very start.
Kaplan advises that a current-state map should show dips and peaks in the emotional journey. That helps only if the dips come from people who made the journey. If you draw a line, say whose journey it describes.
Add the backstage and the handoffs
Below the resident’s row, add who or what makes each step happen. This is where the blueprint’s line of visibility earns its place: the resident sees everything above it, and depends on everything below it without seeing it. Bitner and colleagues also suggest that an online service with no frontline employee can replace the onstage employee row with an onstage technology row. Wenmouth’s online form is exactly that.
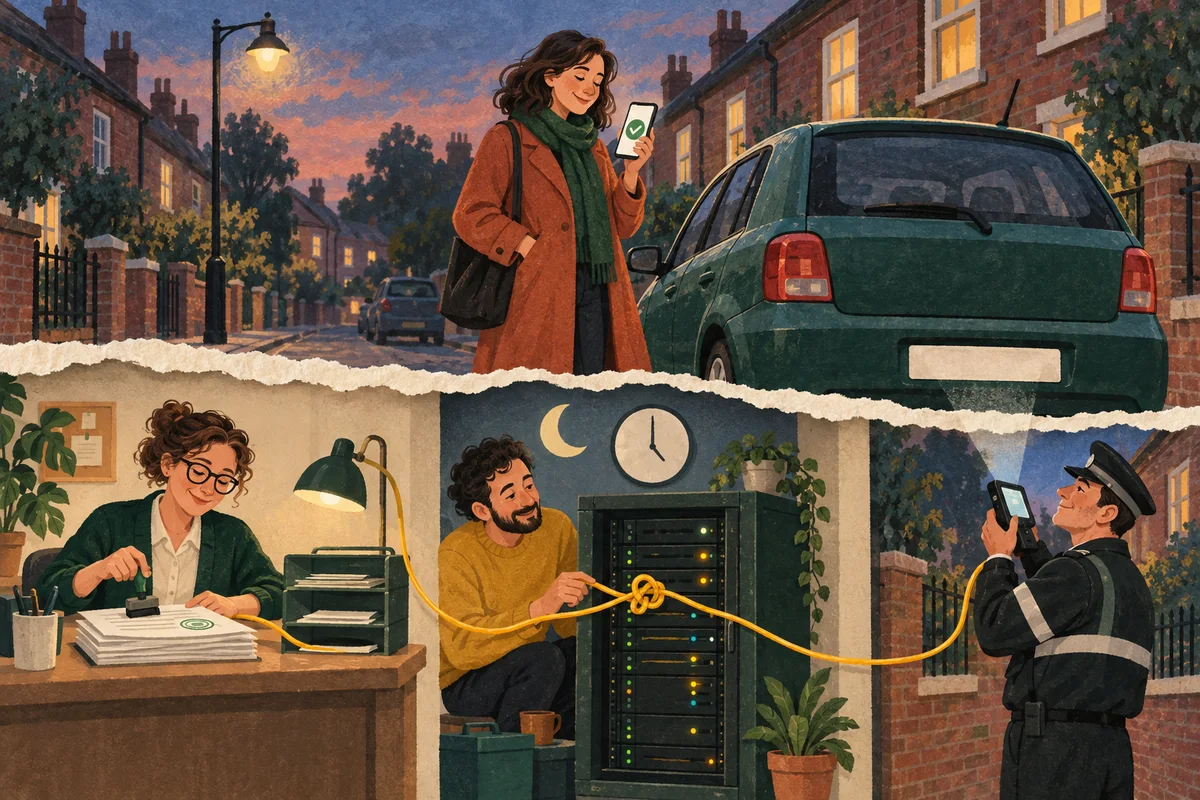
The backstage rows include the permits team checking documents, the IT supplier’s system issuing the virtual permit and sending the permit list to enforcement devices, and enforcement officers checking plates on the street. Follow one application down and across. The permits team approves Amira’s permit in the afternoon and the confirmation email goes out at once. The supplier’s feed to the handhelds, the team learns, runs overnight. An officer checking her street that evening would see no permit.
That handoff never appeared on the resident’s row, because the resident cannot see it. It was sitting in the appeal files and the enforcement supervisor’s account, and became obvious only when the two layers were drawn together. Stakeholder mapping tells you which groups a service affects; the backstage layer shows where in the sequence each of them acts and what they hand on.
Invite the people who do backstage work to correct the draft; Bitner and colleagues suggest blueprints are ideally developed by cross-functional teams. Staff will mention workarounds, such as a permits officer who quietly phones residents whose uploads are unreadable, only if they can do so without being blamed for departing from the process. That depends on psychological safety in the team as much as on the template.
Find the moments that matter
Not every step deserves equal attention. Rosenbaum, Otalora and Ramírez argue that most journey maps are flawed because they assume every customer passes through the same touchpoints and regards them as equally important. Using a shopping-mall case, they propose linking customer research to the map so that a team can see which touchpoints matter most. Lemon and Verhoef likewise stress identifying critical touchpoints, while acknowledging that it is difficult.
In practice, look for three kinds of moment. First, points where the journey can stop: Tom leaving the form at email confirmation. Second, handoffs where responsibility can fall between two desks: the lease letter travelling from Amira’s employer to the permits team. Third, moments whose consequences are out of proportion to their size: a penalty notice issued on the evening of approval can undo a resident’s trust in the whole service.
Where journey maps mislead
The imagined average user. A map of “a typical resident” smooths out exactly the differences that cause trouble. A private car owner with a smartphone may pass through Wenmouth’s process without friction; a map drawn around them would be accurate and useless.
Emotional curves invented in a workshop. As Wenmouth’s first draft showed, they record the team’s empathy rather than residents’ experience.
One map for very different journeys. Amira’s route depends on a document from a third party. Tom’s may depend on an assisted route the online form never mentions. Forcing them into one row hides both. Wenmouth kept a shared set of stage headings and drew the two variants as separate lanes beneath them.
Ignoring assisted and accessible routes. GOV.UK’s introduction to assisted digital support, written for UK government services, says teams must make sure everyone who needs a service can use it, and must research what help people need to use it online. A map built mainly from web analytics cannot meet that standard. Include people who use assistive technology, people applying on someone else’s behalf and people who cannot use the online form at all.
A poster with no owner. A handsome print on the office wall suggests the work is finished. Gibbons lists opportunities, with ownership and metrics, among the insights a map should produce. Without owners, the map is decoration.
Careless use of case data. Call logs, uploads and appeal files contain names, addresses and number plates, and a photograph of a workshop wall travels far. Agree with your data protection lead what you may extract, and put only anonymised extracts or fictional stand-ins on anything shared.
Agree owners, questions and tests
The Wenmouth team ended its second session with decisions rather than a finished picture. The permits team leader took the lease-car problem: rewrite the document guidance to say what a letter from a leasing company or employer must contain, then check the wording with a few lease-car holders before publishing it. That is a small concept test of whether people understand what to provide, not a survey of approval.
The IT supplier’s account manager took the overnight feed. Before anyone designs a fix, the question is how often a newly approved permit meets an enforcement check before the next update, which the supplier can estimate from its logs. The enforcement supervisor took a related policy question to the manager with authority to decide it: how officers should treat a plate whose permit was approved that day. The map exposed that question; it did not settle it.
The contact-centre manager took Tom’s route. The call script needs to say whether an assisted route exists and where. The team considered a staffed phone application and agreed to decide what that first version must do and what it should teach them before promising it publicly.
Where several beliefs compete for attention, assumption mapping helps rank them by consequence and evidence. A future-state map can then show the proposed journey, labelled as a proposal. Turn its key steps into a concept that spells out the work behind each promise, and redraw the current-state map once changes are live.
If the changes alter staff routines, such as officers handling new permits differently, plan communication around the work that changes. Give the map itself a named owner and a review date.
Limitations and evidence
A journey map organises evidence about a sequence of experiences. It cannot tell you how common a problem is, why it happens or whether a proposed fix will work. Frequency needs records or suitable sampling; causes need investigation; fixes need testing. Accounts from a small number of residents can reveal a problem worth pursuing, but not its size.
The research base is mainly conceptual and descriptive. Følstad and Kvale reviewed terminology and approaches in papers published before 2013; they did not test whether mapping improves services. Rosenbaum and colleagues present a single mall case. Lemon and Verhoef synthesise marketing research and call for better mapping methods. NN/g and GOV.UK offer practitioner and institutional guidance, not controlled evaluations. None of these sources shows that journey mapping by itself improves outcomes.
Maps also age. Date yours, keep the evidence behind each cell, and treat it as a working record rather than a finished poster. The Wenmouth example is fictional and illustrates decisions, not results. The honest test of a journey map is whether it changed what someone investigated or decided next.
Sources:
- Sarah Gibbons, Nielsen Norman Group (2018). Journey Mapping 101.
- Kate Kaplan, Nielsen Norman Group (2020). Journey-Mapping Approaches: 2 Critical Decisions To Make Before You Begin.
- Katherine N. Lemon and Peter C. Verhoef (2016). Understanding customer experience throughout the customer journey.
- Asbjørn Følstad and Knut Kvale (2018). Customer journeys: a systematic literature review.
- Mary Jo Bitner, Amy L. Ostrom and Felicia N. Morgan (2008). Service blueprinting: a practical technique for service innovation.
- Mark S. Rosenbaum, Mauricio Losada Otalora and Germán Contreras Ramírez (2017). How to create a realistic customer journey map.
- GOV.UK User research community (2017). Creating an experience map.
- GOV.UK Assisted digital and digital take-up community (n.d.). Assisted digital support: an introduction.